How to Validate Web Traffic
The way I validate pixels are firing on a site is to use the Network tab in Chrome Developer Tools to analyze the HTTP requests. If that sounds scary, don’t worry– this guide will walk you through how to do that.
Why This Approach?
While many third parties provide tools (such as the Facebook Pixel Helper or Tag Assistant) to debug and validate pixels, these tools are often looking for the tag to be implemented using a very specific process. Since our pixels are generally deployed through a Tag Management System, some third party tools can be tripped up. Looking at HTTP requests mitigates this potential issue.
Also, it’s free! Chrome is free to download and the developer tools are included!
Some Background: What is an HTTP Request?
The process for getting at tag in place usually goes something like this:
- A marketing team or agency decides they want to track some action on the site.
- They get code from a third party to trigger that pixel based off of some action a website visitor takes. This pixel is an image file that resides on the server of the third party (Facebook, for example).
- The implementation team deploys the pixel through the Tag Management System (TMS).
- When the website visitor performs the desired action, a request to the third party’s server is made using the HTTP protocol.
- Open the Google Chrome Browser and navigate to a Website
- Right click anywhere on the page and select “Inspect” from the contextual menu. This opens Chrome Developer Tools.
- By default you’ll be on the “Elements” tab. Click on the “Network” tab and check “Preserve Log” and “Disable Cache”:

Why Does This Matter?
The Network tab in Chrome Developer tools monitors HTTP requests. This includes all the code files, images, stylesheets, and other files needed to make the page run, including TRACKING PIXELS! So, by monitoring the Network tab we can see if the request for our pixel was made.
So, now that we have that foundation, let’s move on to how to verify a pixel is firing.
The Setup
This section will demonstrate how to get to Chrome Developer Tools and the Network tab.
An Example
A third party has generated the Floodlight Tag below to track users that arrive on the homepage:
<!--

Start of DoubleClick Floodlight Tag: Please do not remove

Activity name of this tag: Testing

URL of the webpage where the tag is expected to be placed: www.xyz.com

This tag must be placed between the <body> and </body> tags, as close as possible to the opening tag.

Creation Date: 03/12/2018

-->
<script type="text/javascript">

var axel = Math.random() + "";

var a = axel * 10000000000000;

document.write('<iframe src="https://4887467.fls.doubleclick.net/
activityi;src=1234567;type=tester;cat=meat123;
dc_lat=;dc_rdid=;tag_for_child_directed_treatment=;ord=' + a + '?" width="1" height="1" frameborder="0" style="display:none"></iframe>');

</script>
<!-- End of DoubleClick Floodlight Tag: Please do not remove -->
Looking at this code can be overwhelming at first, but for validation purposes, we’re really only interested in the value of the “cat” parameter, which is highlighted above. (Note than when validating a tag in the wild, you’ll want to make sure the “type” and “src” parameters match as well.)
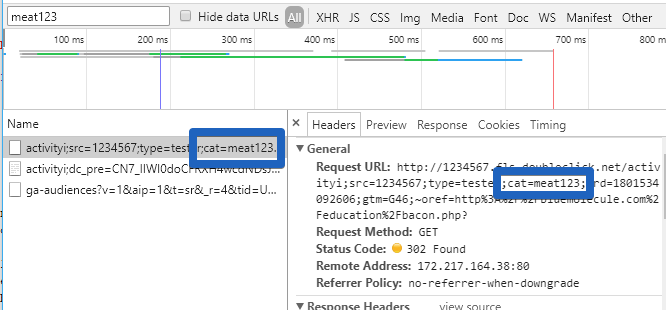
On the Network tab, we can filter the network requests by this value so that we can see an indication when the HTTP request is made:

Note that this would be the correct value to filter on for this Floodlight pixel. To see what values can be used for other pixels, see this table.
Now if we navigate to the homepage and the tag has been implemented correctly, we would expect to see an HTTP request. If we click on that request, we can see more detail about it, including querystring parameters that may have been passed with it.

Wrapping Up
Knowing how to access and read the Network tab in Chrome Developer Tools will not only allow you to validate that you are making the calls you expect to be making, but it also allow you to get an understanding of what data is being passed with those calls.

Join the Conversation...